DATA ✴
Comparing where my notifications come from the most ㋡
INTRODUCTION ✴
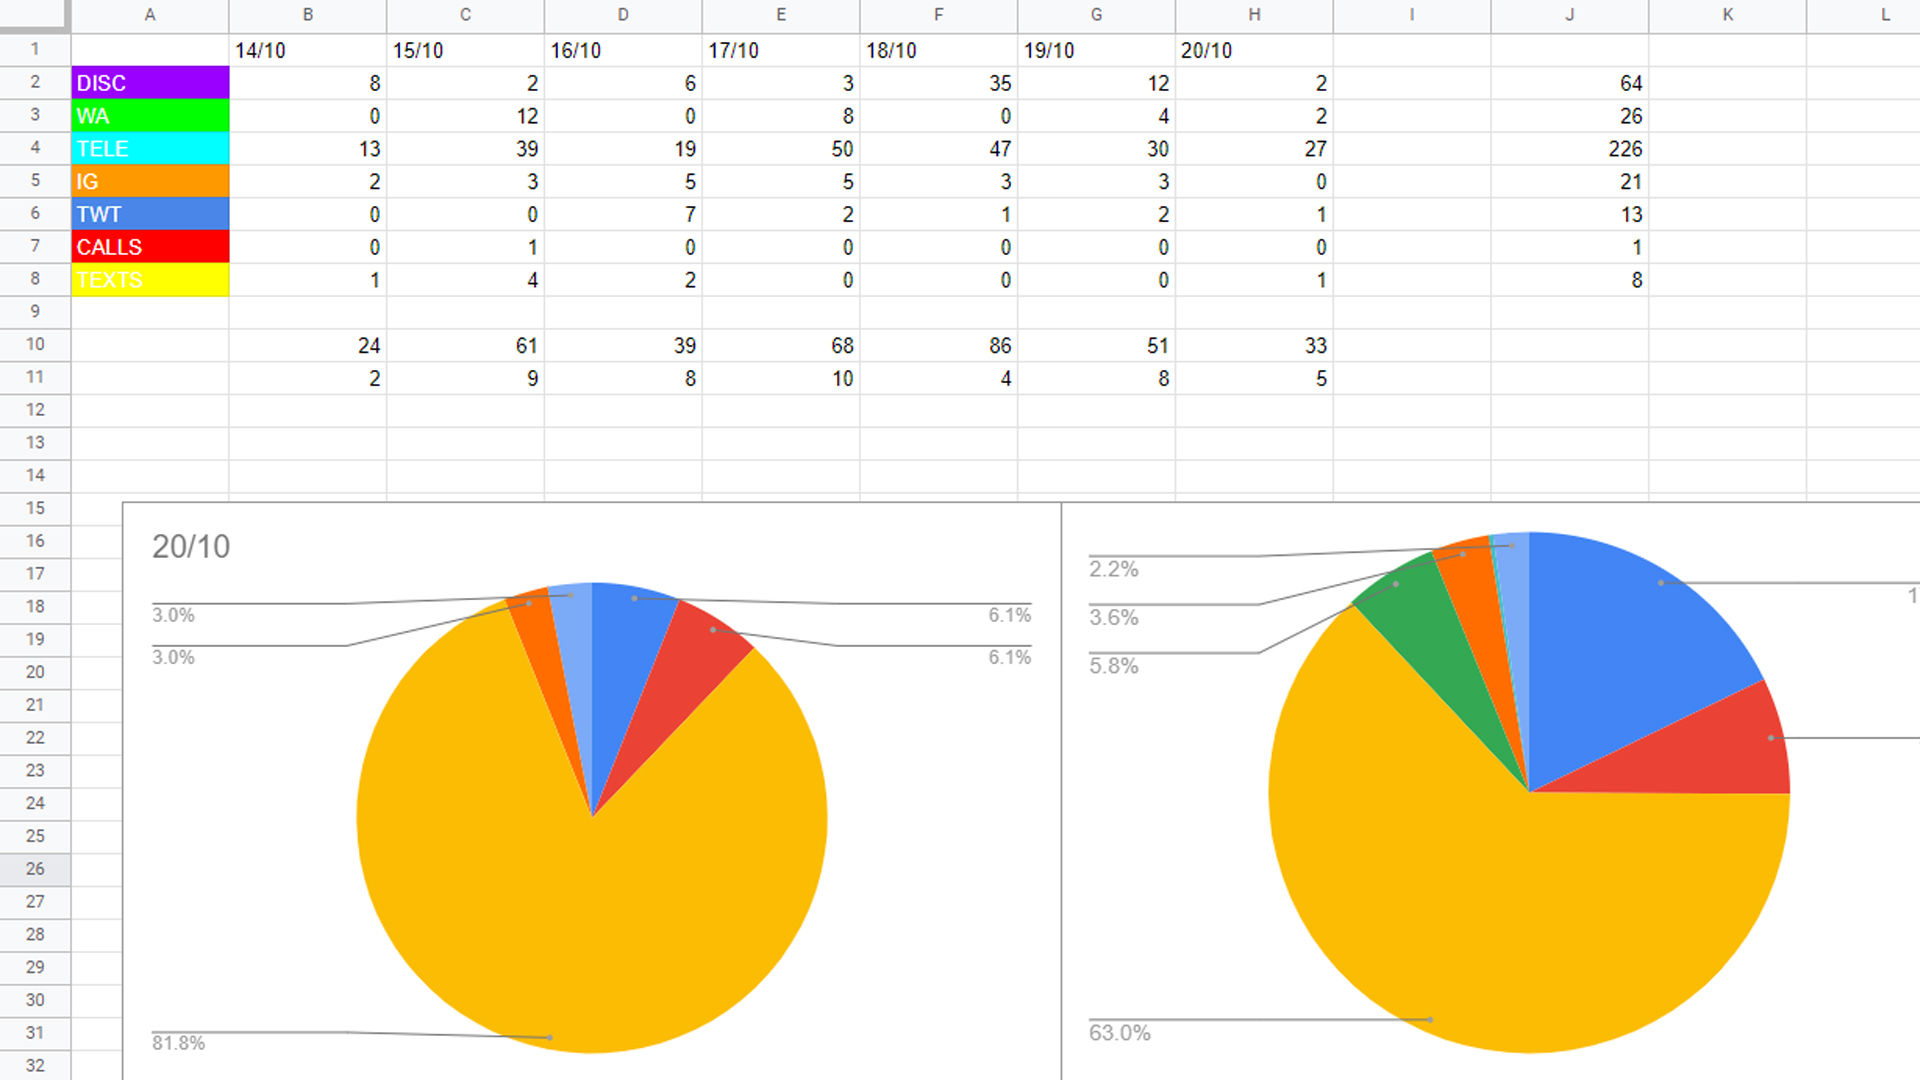
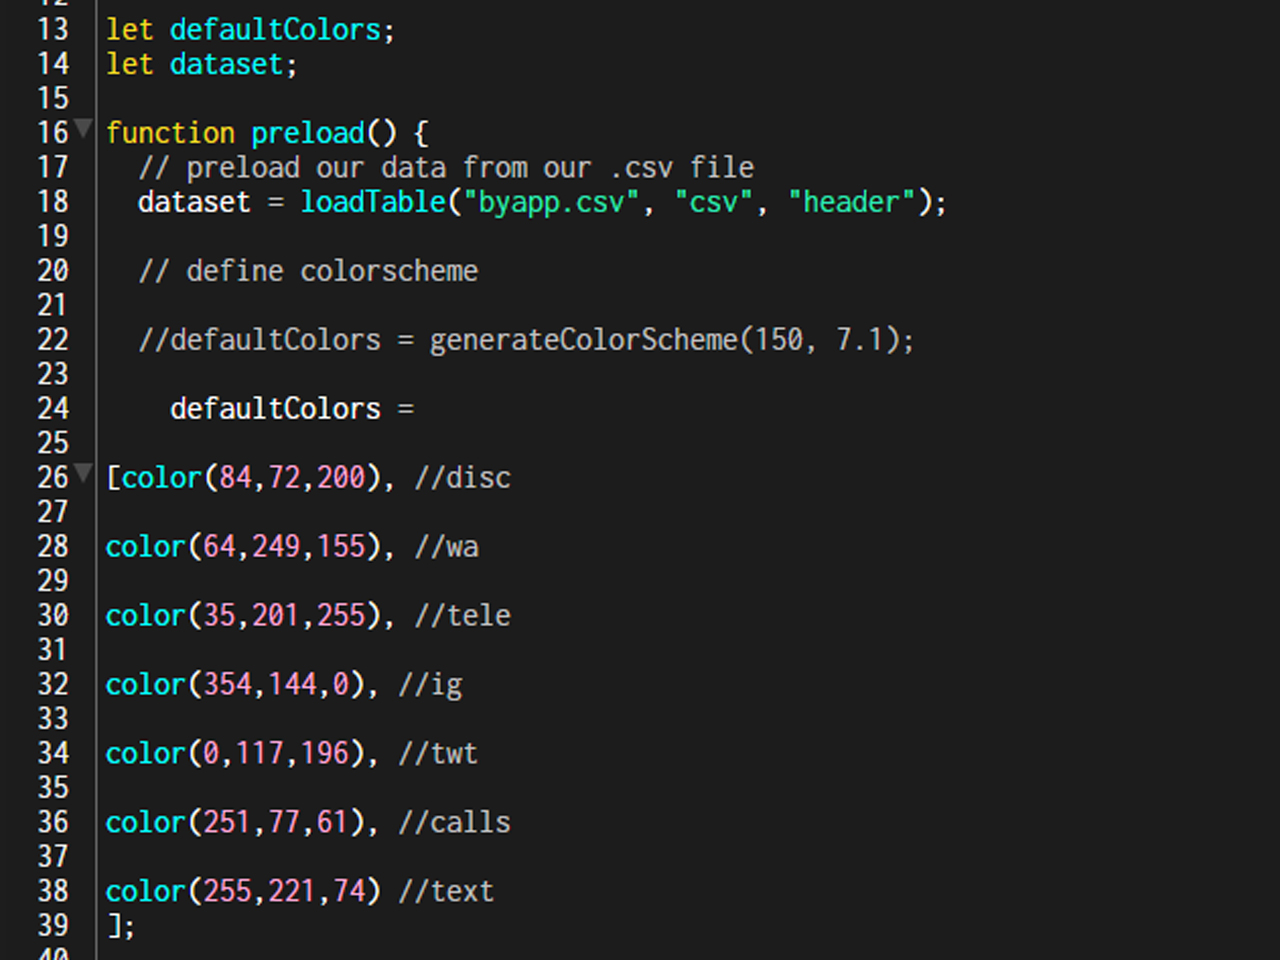
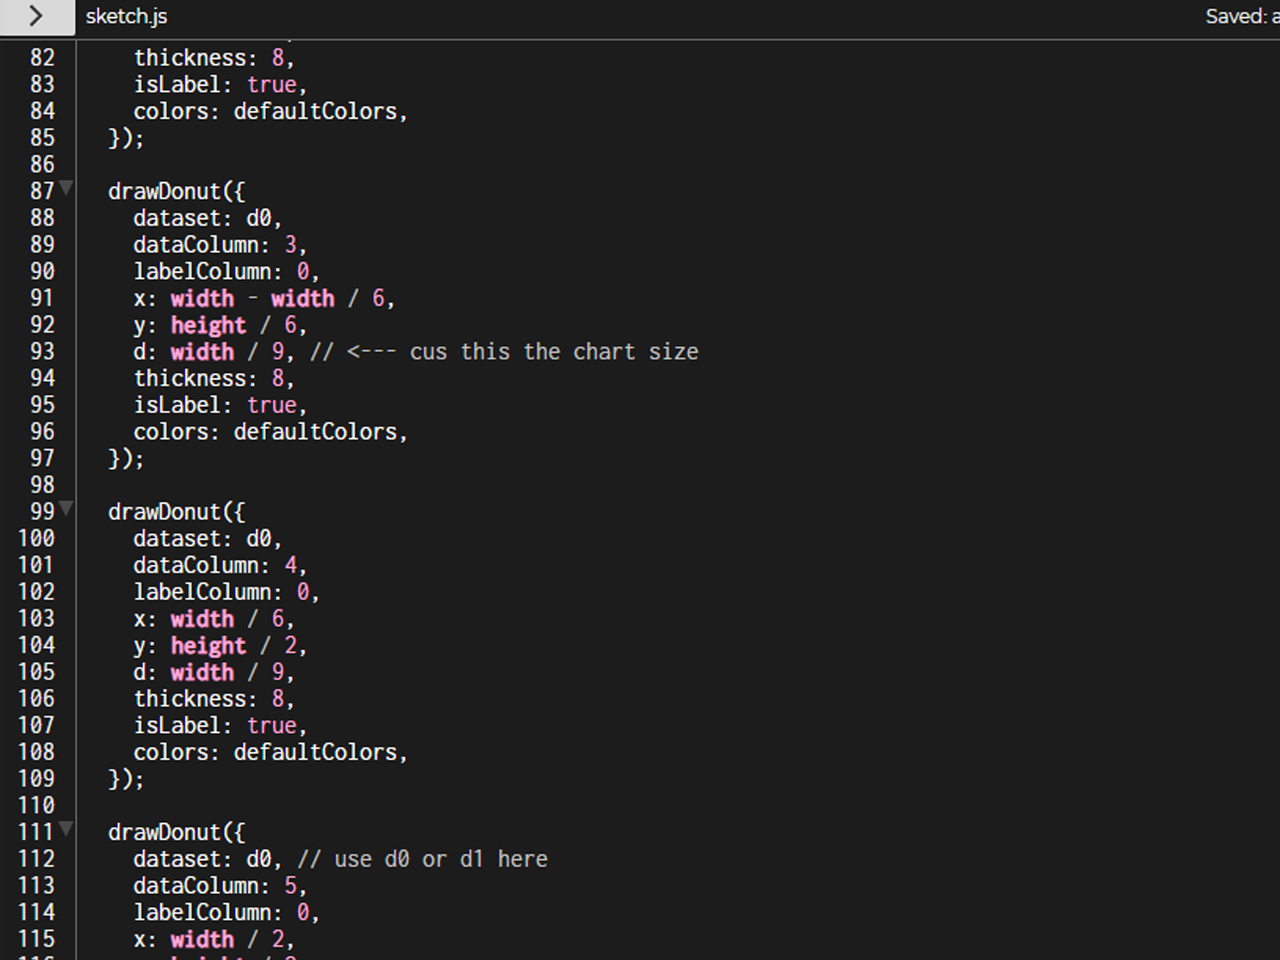
I used Donut Charts to visualise the amount of notifications I received from each app, for each day. Each donut chart represents one day. I decided to just use a simple donut chart because it's pretty straight to the point, the visualisation here was just to show roughly how the amount of notifications I receive from each app and it's easy to compare the difference in the amounts with the donut chart and the colours.
DATA VISUALISATION ✴
How I've used it is to show the percentages of the notifications from the apps I received them from. It can be compared from just a daily context to which app had more notifications come in, and it can also be compared against the other days. The dimension of the data I was trying to show here was just to roughly gauge the amount of notifications that came in, from where, and how many, the donut chart made it easier to see and compare.
FINDINGS ✴
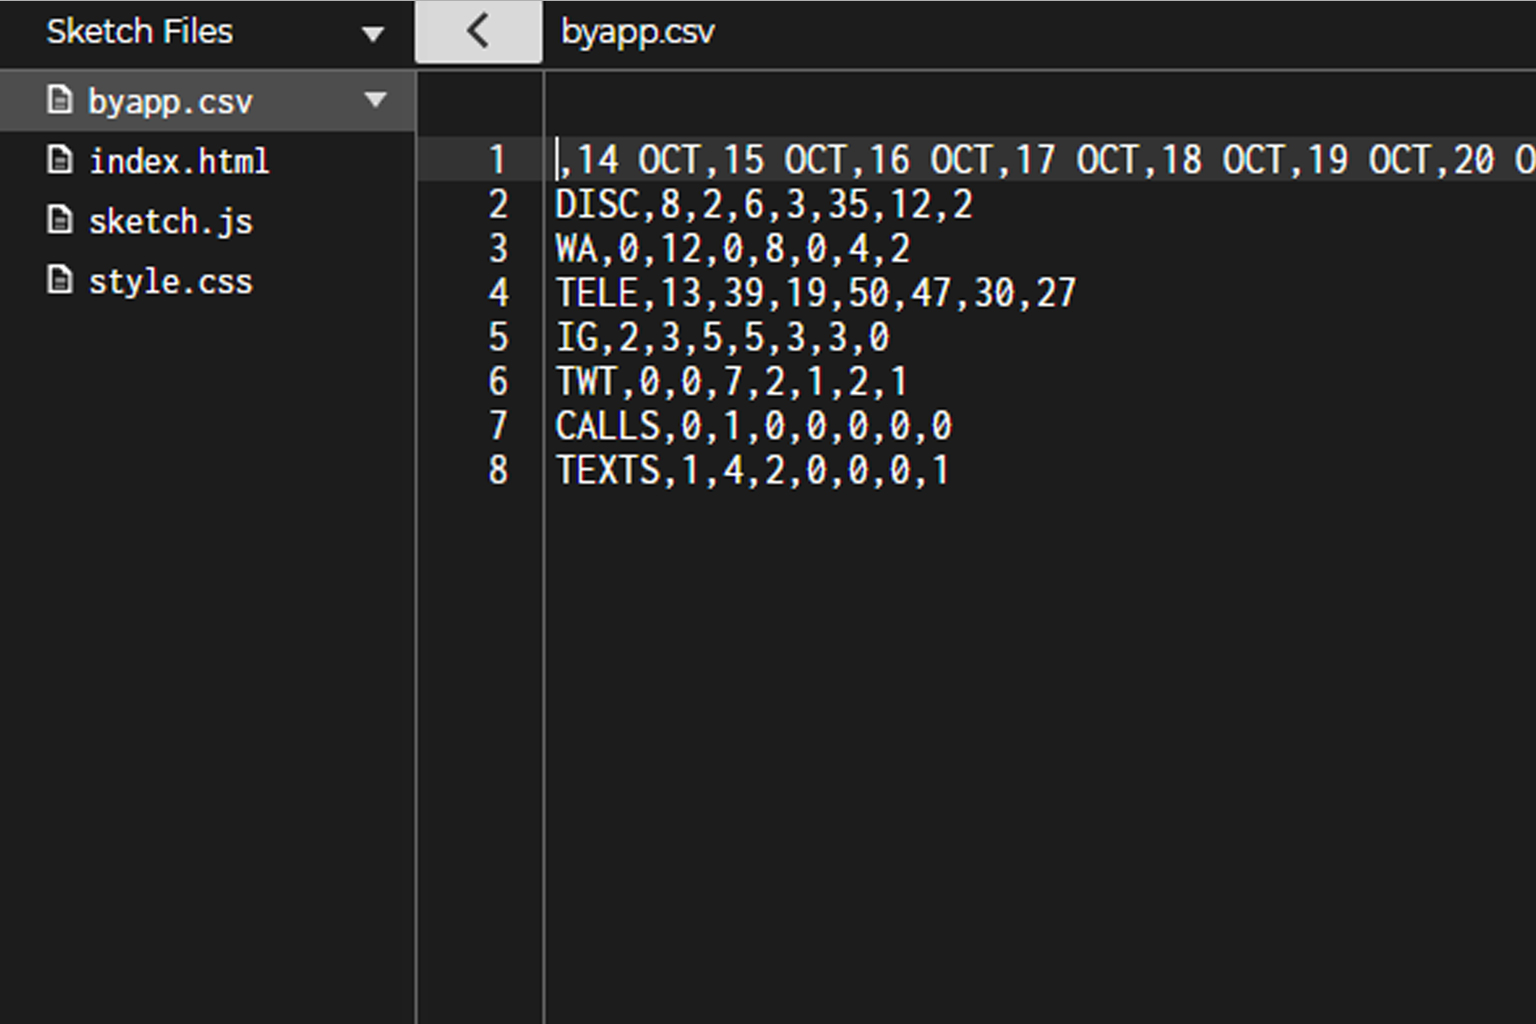
What I know from this is that the highest amount of notifications I receive from an app is Telegram, and the least amount of notifications I get is Calls. Over the course of the 7 days, the total amount of telegram notifications received was 226, followed by Discord with 64, Whatsapp with 26, Instagram with 21, Twitter with 13 notifications, then 8 texts and lastly 1 missed call.
The total amount of notifications differed alot depending on the day as well, it's not pictured here as the donut chart presents 100%, however, it differs from day to day as it depends alot on what I was doing. 14/10 saw 24 notifications because only 6 hours of data was recorded, the following days had higher numbers, 15/10 with 61 overall notifications, 16/10 with 39, 17/10 with 68, 18/10 with the highest number at 86, followed by 19/10 with 51 and 20/10 with 33.
INSIGHTS ✴
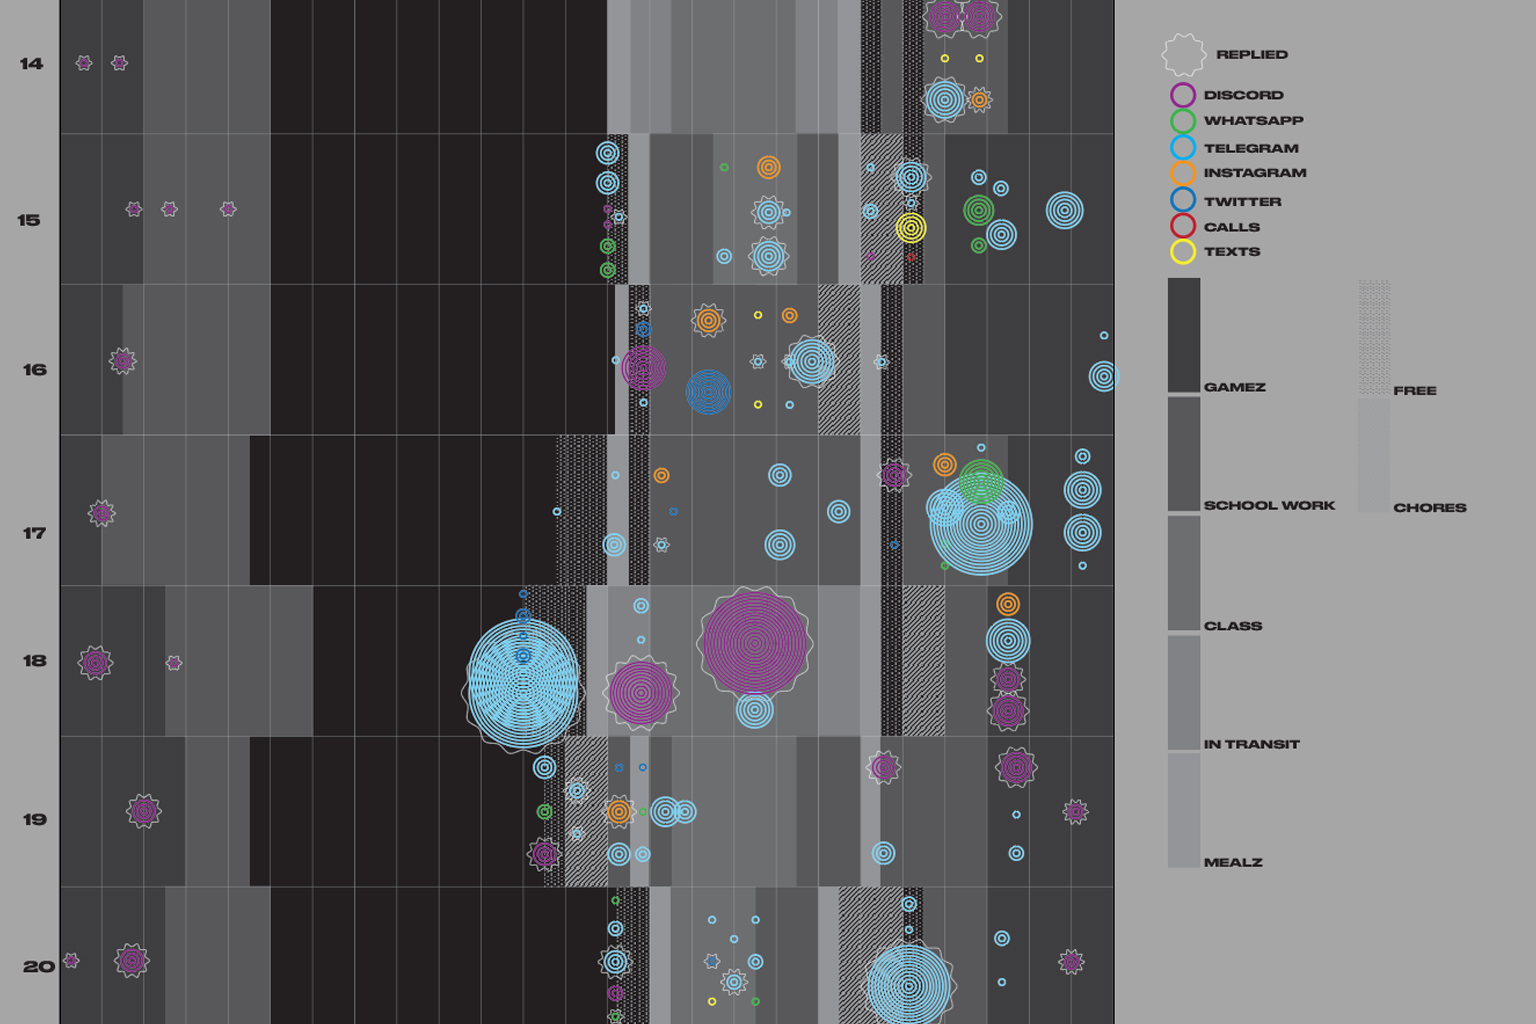
What came from knowing this was the fact that I never really broke down where my notifications come from, I haven't ever notice how I barely received calls and text messages, the most common notifications are from Telegram and how I barely reply and open these notifications at all.
There actually is a surprisingly large amount of activity in the notifications coming into my phone, but it surprises me how majority of it only comes from messaging apps like Telegram and Discord, compared to other social media notifications which I had assumed to have more than the Messaging apps. I think I have this perception because of how I don't often reply people but the notifications do come in, nevertheless.
CONCLUSION ✴
Taking a step back from this made me realise that I actually do have alot of activity on my phone but I don't exactly pay attention to it because of how much I wanted to avoid having interactions with others through the interwebs because there was just alot of negativity that I see across social media and the news. There often would be many unofficial news outlets that would post gossip under the guise of news to bring others down, and with the rise and fall of COVID cases, there would be a lot of talk on the situation as well as updates that never fail to make a day gloomy because the situation is stagnant and not improving. There's just a lot of these negative news ocurring on the day to day feed and I've never noticed how apart from messaging apps to stay connected with close friends and family, I don't often hang on the social media feed enough to receive notifications from them.